
A couple of years ago, the president of the New South Wales (NSW) Science Teachers Association commented on a remarkable statistic. She noted a sharp decline in the number of candidates sitting the Chemistry and Physics Higher School Certificate (HSC) exams.
Ms Shepherd was quick to point out that the overall number of science exams pupils signed up for hadn't dropped off. It's just that more were selecting Biology or Earth and Environmental Science instead of Chemistry and Physics.
Of all the reasons students might make this shift, Ms Shepherd points to one factor that seems to drive pupils away from Chemistry (and Physics) exams. In 2018, The NSW Education Standards Authority (NESA) overhauled select HSCs. Chemistry and Physics courses and their examinations became more theoretical and mathematical.
Starting in 2019, the first rollout for the new exams we administered, Chemistry enrolments were down 9% (Physics enrolments were down 15%).
And then, COVID came along to disrupt data collection and modelling (and everyday life). Still, these data prove why science-loving learners scramble for help to better understand their course content and what's expected of them on their exams.
To that end, we go over the HSC Chemistry data sheet in detail, covering everything from its purpose to how to connect that information to your study materials.


Why the HSC Chemistry Data Sheet
The older version of the HSC Chemistry exam covered the usual science information such as atomic structure, properties of matter and select areas of organic chemistry. Roughly half the test was multiple-choice questions and the other half called for essay-type responses. Also, exam candidates had to write formulae correctly and explain or draw chemical structures.
With diligent revision, any student could score well on that test. It was structured like ordinary school exams and the questions were conventional.
Not to undercut any previous test-takers' achievements but the old-format exam was doable, so to speak. The new exam, by contrast, requires candidates to know equations and formulae, standard potentials and absorption rates. Not just a few, but entire pages full.
Even the most dedicated test taker would be put off by the idea of memorising all of that information. It would be so easy to confuse magnesium carbonate's solubility constant (6.82 x 10⁻⁶) and lead II bromide's (6.60 x 10⁻⁶), wouldn't it? NESA and your teachers are all for pupils proving their intellect but not to such as degree that no pupil would venture to try.
That's why, as you enter the HSC Chemistry examination room, you'll find the HSC Chemistry data sheet. Of course, you should get familiar with this four-page document before you go into the testing centre. You can find a copy of this sheet bundled in with the HSC Chemistry past papers you download for exam revision.
Now, let's go over what you'll find, page by page, on this test-taking tool.

HSC Chemistry Data Sheet, Page 1
This invaluable document's first page details solubility constants at 25o for 32 different chemical compounds. We've listed two examples of such in the previous segment. At the top of the page, you'll find formulae for various chemical phenomena, such as the ideal gas law (PV = nRT) and molar concentration (n = m/MM).
There is no legend, explanation or guide to interpret these symbols so you will have to remember what they all stand for. You should have become familiar with all of these symbols, formulae and constants because you've been using them throughout your HSC Chemistry course. As you revise for your exam, you may need a bit of a refresher on what all of them mean.
You'll find some of the relevant formulas in Study Module 5; the rest are in the next module. Module 8 will show you a full array of solubility constants. Of course, before you can calculate any constants, you have to know the proper equation: Ksp=[C]c[D]d. This equation does not feature on the HSC Chemistry data sheet so it's best you memorise it.
Page 2 HSC Chemistry Data Sheet
Page 2 presents you with three different tables. The first details infrared absorption data and the next one lists 13Carbon nuclear magnetic resonance (NMR) chemical shift data. The last one presents approximate values for ultraviolet (UV) absorption data. For this data set, examiners make it a point to emphasise that this list is not definitive.
Now, let's define the values these charts represent.
Wavenumber in the infrared chart is the inverse of wavelength. It represents infrared radiation energy absorbed by the indicated sample. Acids and alcohols absorb infrared radiation via their bonds, causing them to vibrate or rotate differently.
Carbon NMR describes how a nucleus responds to a magnetic field relative to a given standard. Luckily, your course only uses one standard, tetramethylsilane (TMS, 0 parts per million - ppm). A nucleus close to electronegative atoms like oxygen or nitrogen will shift from the standard.
The UV absorption lambda denotes a bond's peak maximum radiation absorption. The principle is like the infrared absorption described above.
You'll find only a few UV absorption values on your sheet; they mostly represent highly polar bonds.
Get help with class with a VCE chemistry tutor Melbourne.

All three of these charts list functional groups and their corresponding numerical values. Those values represent where each functional group appears in graphs of their indicated spectroscopic techniques. To get more clarity on these groups and values, comb carefully through your textbook's Module 8. That's where they've been 'lifted' from.
Looking over these functional groups might give you the idea that the HSC Chemistry exam is hard. But describing anything as difficult - or, for that matter, easy, is a judgment call. What's hard for one student might be a breeze for you, and vice versa. The trick is to not become overwhelmed by all the information you have to take in.
When you look at HSC Chemistry that way, this test is no more difficult than any other you'll sit for your Australian Tertiary Assessment Rating (ATAR).
Third Page of the HSC Chemistry Data Sheet
This page is a bit of a mystery. It lists an assortment of standard potentials, again with no legend or explanation. Remembering what all of these symbols mean should be no mean feat; they all saw their time in the spotlight during your Year 11 Chemistry studies. Luckily, you shouldn't need to reference them for this exam.
Do you remember studying metal reactivity and galvanic cells when you were a Year 11 student? That's what this list of potentials pertains to. Hence, the mystery: why is it included in the Year 12 exam handout?
Still, it's better to have more information than less, and you may even find something on that list to jog your memory to another question's answer.
Keep up with your classes with a chemistry tutor VCE on Superprof.
HSC Chemistry Data Sheet: Last Page
Earlier, it might have sounded flippant when we said that this Chemistry exam being difficult is a matter of individual perspective. Being out of school for a while, I have to confess that just looking over this data sheet caused a mini panic wave, especially the first two pages. But the last page felt wholly familiar; comfortable, even.
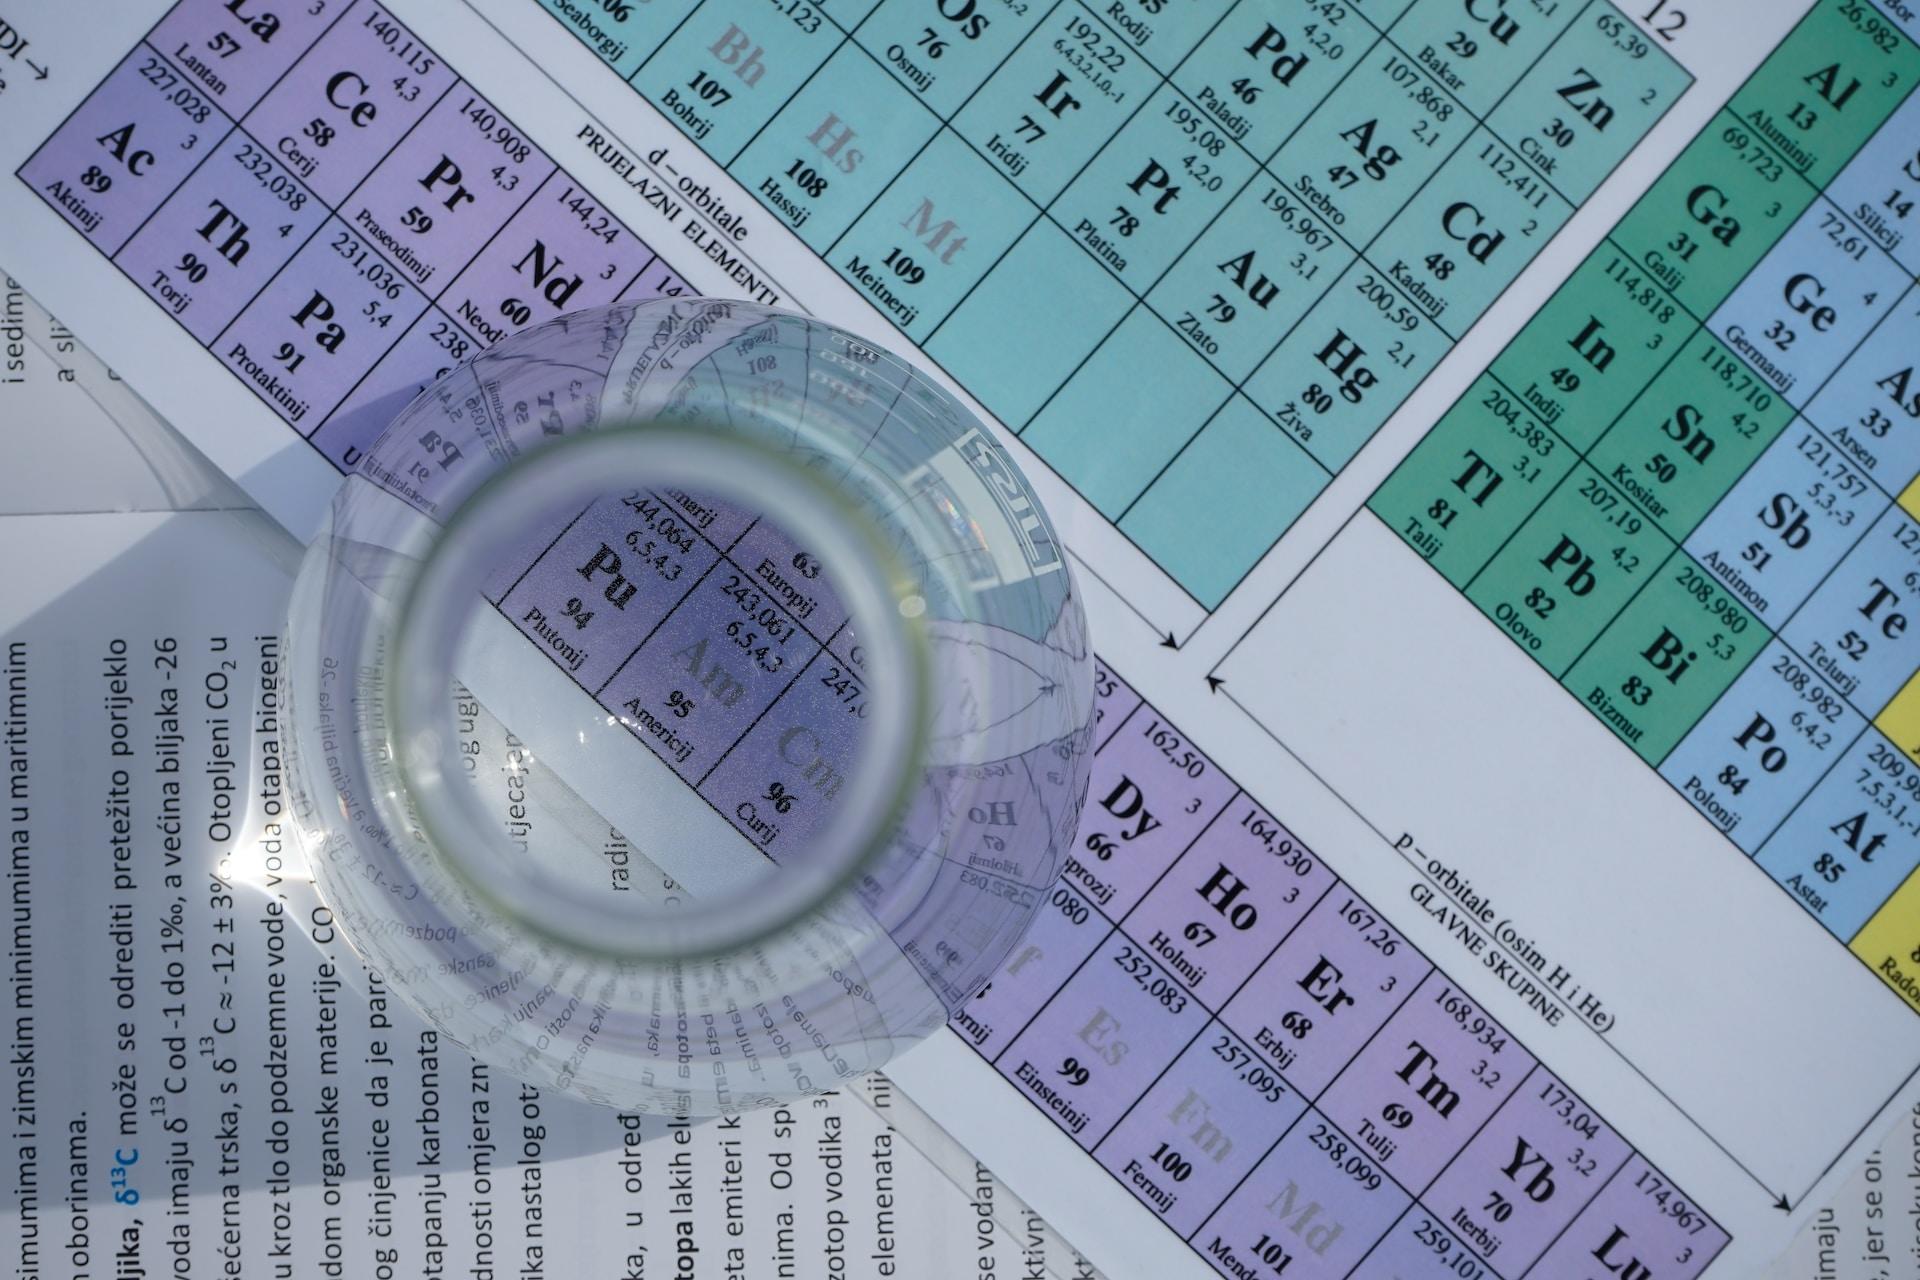
Who doesn't recognise the periodic table of elements? Even people decades out of school who in no way dabble in chemistry or science can identify it at a glance. But for you, who are getting ready to sit exams, Page 4's diagram is not a nostalgic inclusion meant to comfort.
It gives you the molar masses you need to do mole calculations, something your Year 12 syllabus covered early in the course. These values also help with later coursework, especially for fragments in mass spectroscopy. The list gives you valence and/or ionic changes, too. You'll need those to confirm the correct ionic formulas. In Module 7, as you cover oxidation numbers and bonding patterns, you can rely on your handy periodic table of elements to help you get the right answers.
Some people believe in talismans. Some athletes won't wash their game socks for fear of breaking their winning streak and some performers conduct small rituals before taking the stage. The phrase 'Break a leg!' is an example of such.
When I was a student, my lucky pen went into every examination centre with me.
But if I were taking this exam, I would consider the HSC Chemistry data sheet an extra lucky charm. This document is like having a point of reference that helps you refine what you know and how to use that knowledge. And if you take the time to go over the whole document when you start revising, it will serve as a fine introduction to your HSC Chemistry exam.
Looking for a VCE chemistry tutor? Find tutors of all kinds and subjects on Superprof!
Summarise with AI:
Did you like this article? Leave a rating!