

It has become appallingly obvious that our technology has exceeded our humanity.
Albert Einstein
If you have spent any time navigating the contemporary jobs market, you will likely have seen that the overwhelming majority of roles have a preference for or outright require applicants who have proficiency in using Microsoft Excel.
So, if you have ambitions of becoming more valuable in your current role or are looking to secure work in a new field, then learning more about the software is an effective means of doing so!
You can do just about anything through Excel, from performing simple calculations to complex data analysis, and it can also go a long way in streamlining your workflow and keeping you organized at work.
In this article, we’ll get you up to speed with Microsoft Excel so that you’re able to perform the basic Excel formulas that might be required across many of the roles you’ve been eyeing.


Useful Excel Shortcuts to Help Streamline Your Workflow
Excel isn’t necessarily an intuitive program. You may need to spend a few minutes in order to understand certain functions or tasks.
To help you use Excel more effectively, you should learn a few of the basic keyboard shortcuts. Shortcuts are very useful for those who struggle to use a mouse.
[table “us_101176” not found /]There are plenty of shortcuts that can be very useful in Microsoft Office suite. You can use shortcuts to insert rows, columns, and a whole plethora of other operations.
The more time you spend with Excel, the more shortcuts you’ll learn. Bit by bit, you’ll start using Excel more efficiently, navigating around an Excel worksheet with the greatest of ease. Now you're ready to excel with Excel!
Covering the Basics of Excel
🧑💻 Navigating the Interface
🗒️ Starting a Spreadsheet
🟰 Using Functions and Formulas
You’re likely already familiar with Excel for its application in the business world and its subsequent inclusion across many academic and professional courses in today's day and age.
But why has the software received so much traction around the world? Well, it has certainly revolutionized the way we work with data.

Its popularity can be attributed to its effectiveness as a varied tool that saves professionals and students alike countless hours of manual data entry and calculation tasks.
With an understanding of how to navigate Excel, you can turn sheets of data into visually appealing charts and graphs. It can also be used to help spot trends and patterns using features like data bars, color coding, and icons.
Its potential use cases in the corporate setting also extend to inventory tracking, client management, financial accounting, and project management, which enhance the organisation and productive capacity of a business tenfold.
Understanding Excel's Interface
Often, the most challenging stage of learning a new software is being able to navigate it. If you have never used Excel before, then it's quite likely that you’re going to find it quite intimidating but don’t let that deter you from learning the platform.
It’s actually easier than it looks! Upon booting up Excel on your PC, you’ll have a ribbon at the top of your screen. This is going to be your toolkit when working on your spreadsheets.
You’ll notice that there are tabs labeled Home, Insert, and Formulas, which will help you navigate through the various functions you’ve got at your disposal.
How to Start an Excel Spreadsheet?
Every great journey begins with a single step, so let’s take a look at how you can get your canvas ready by opening up your very own Excel spreadsheet.
In order to open this up on your own computer, you’ll just need to open up the software and select "Blank workbook." From here, you can begin typing, editing and inputting your desired values into any cell.
If you want to fill a series, you can begin the first two values, such as Jan and Feb, select them and drag the fill handle!
Remember, any edits that you make to your spreadsheet will need to be saved, a process that can be performed rather seamlessly through the shortcut Ctrl+S.
Basic Excel Formulas
➕ Add
➖ Subtract
✖️ Multiply
➗ Divide
❗️ Reference
Okay, now that you’re aware of how to navigate around Microsoft Excel, let’s have a look at some of the basic formulas you can use when calculating and analyzing data.
In order to bring up the formulas, the process is largely the same; you just have to enter an equal sign (=) into the desired cell and then include numbers, cell references, and operators.
Addition and Subtraction
When working with large data sets, you’re probably not going to want to set hours or days aside for punching numbers into a calculator. At least not when there’s an easier route you can take.
If you are looking to add numbers, you would simply enter the equals sign as mentioned above, along with your desired sum.
For example, when it comes to addition and subtraction, you would enter your equation along the lines of the following ‘=5+10’ or ‘=10-5’ into a cell, and Excel will display the results, 15 and 5, respectively.
Multiplication and Division
If your calculations require some multiplication and division, you just have to use the asterisk (*) to multiply and the forward-slash (/) to divide.
In order to multiply 5 by 3, you would enter ‘=5*3’, and if you wanted to divide 10 by 2, your equation would look like ‘=10/2’.
Not as hard as you might have thought right?
Using Cell References
A great little tip that will go a long way in enhancing your capacity it becoming familiar with call references.
Instead of typing numbers directly, like we touched on in the formulas above, you would simply refer to an existing cell on your worksheet.
Globally, Excel boasts a user base of approximately 1.1 to 1.5 billion as of 2023.
So, your input might look something like ‘=C1+D1’, making the formula dynamic and allowing it to update if any of the values included were to change.
Essential Excel Functions
➕ SUM Function
🔢 COUNT Function
🧮 AVERAGE Function
🤷♀️ Conditional Function
With a bit of practice under your belt with the previous formulas, taking a step up and trying your hand at some of the most essential Excel functions won’t come with the same learning curve.
SUM Function
A key Excel function to learn for your personal use or to help with your homework is the SUM function.
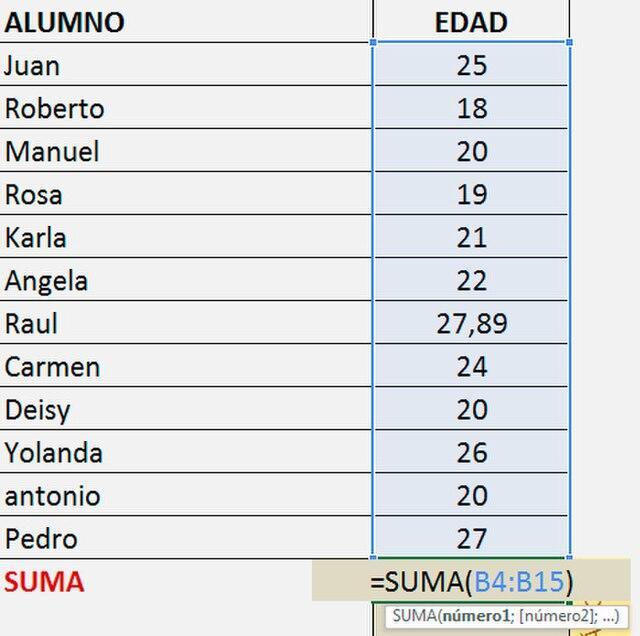
If your spreadsheet is packed with rows of data, the sum function will enable you to add up all of the values in a matter of seconds.
All you'll have to do is enter ‘=SUM(A1:A10)’ into your desired cell or something like ‘=SUM(A1:A5, B1:B5)’, if you’re looking to add from multiple ranges of data.
COUNT Function
The COUNT function is another major time saver that you’ll want to add to your arsenal. This will tell you exactly how many cells in a range contain numbers and save you from having to scroll through the spreadsheet having to count by yourself.
If this is something you could do within your line of work, you can simply enter ‘=COUNT(A1:A20)’ and substitute your respective range.
AVERAGE Function
Another self-explanatory yet crucial formula is the AVERAGE function, which calculates the mean of your desired range of cells.
So, the formula you’re going to be entering should look something like ‘=AVERAGE(B2:B8)’. Only you’re going to substitute what's between the brackets with your own range of cells.
You'll find a number of functions that allow you to calculate the average in a number of different ways. Some of the most common functions when it comes to finding averages include the modal and median numbers.
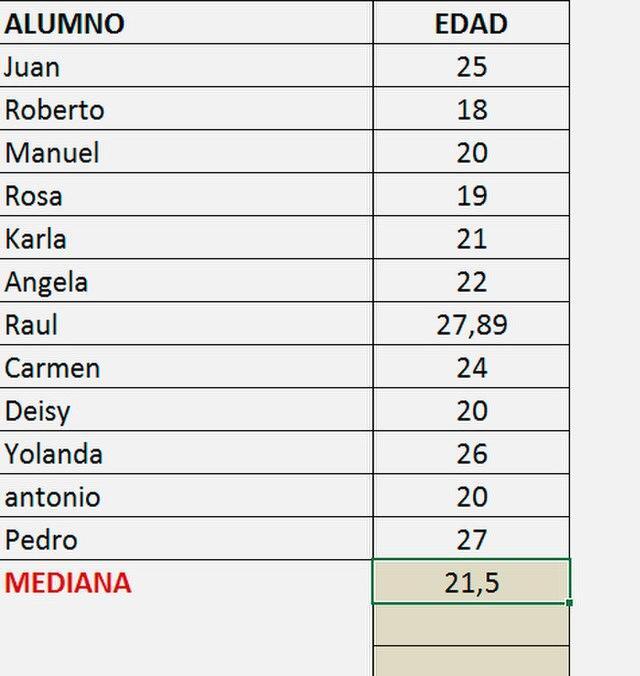
These are the most frequently occurring values in your spreadsheet, and the middle value is that of the highlighted cells, respectively.
IF, AND, OR and NOT Functions
The next functions we’re going to look at are on the intermediate to the advanced side of Excel, so if you’ve worked your way through to this point, take a moment to give yourself a well-deserved pat on the back.
These logical functions allow you to create more complex formulas. The most commonly used would be the IF function, which allows you to make conditional calculations that can help you catagorize your data and make it more readable.
With a rather simple formula ‘=IF(A1>10,"High","Low”)’ , you could turn a spreadsheet filled with values into a more digestible data set, allowing you to filter your cells according to the categories you’ve defined.
The example above would return a value of "High" if it is greater than 10 and "Low" if not. The remaining functions AND, OR, and NOT act as blocks around your conditional calculations, allowing you to add additional criteria to the categories you create.

To compare different data, you can use logical operators including equal (=), different (<>), greater than (>), greater than or equal to (>=), less than (<), or less than or equal to (<=).
Thus, the AND function indicates that both conditions must be met for a positive result. The OR function indicates that only one of the conditions needs to be met for the result to be positive. The NOT function indicates that the condition mustn’t be met in order for the result to be positive.
How Do You Create a Graph in Excel?
In addition to creating spreadsheets, Excel is also great at creating different types of graphs. You can use the data from your spreadsheet to create different types of graphs. You can pick the type of graph that best suits your data.
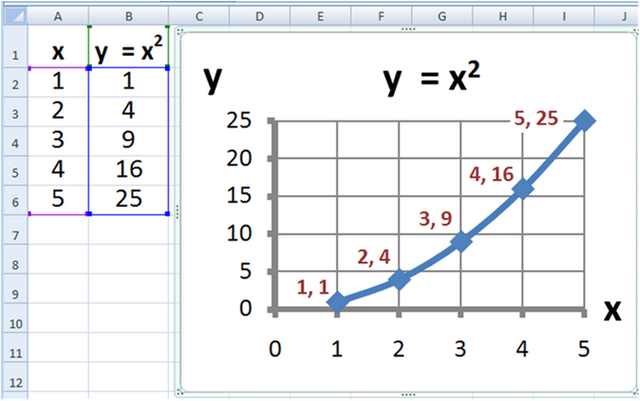
Just like with a spreadsheet or table, you need to enter your data in the rows and columns in your current sheet. The data could be from one or several categories, depending on your project.
You just need to choose the cells that you’re interested in and then click “Insert”. “Chart” will be one of the options. By clicking on one of the symbols, a number of subcategories will appear. There’s a large choice of different styles available.
Your chart will appear on your Excel spreadsheet. However, you can modify the formatting. You can click on the graph and then on the “Design” tab.
Start Developing Your Excel Skills
Microsoft Excel doesn’t need to be complicated and it can help you in your everyday life at work. In fact, you can create charts to present a project to your boss, create reports, or manage your expenses.
It can be much easier to understand information if it’s presented visually.
If you need more help on how to use Excel, you can get tutorials with a private IT tutor on Superprof.
Whether you need help creating a macro sheet, managing a workbook, working with templates, or even using other spreadsheet software, you can get Excel training with one-to-one tutoring or learn more about Excel online with Superprof.
Summarise with AI:
Did you like this article? Leave a rating!