

The median is a useful measure of central tendency in statistics. Statisticians often want a single value to represent a typical result, and the median can serve that purpose. Here, we'll look at the median in statistics and show how to find it for a data set.
Key Takeaways
- The median in statistics is the middle value of an ordered dataset.
- It is a measure of central tendency that divides a dataset into two equal halves.
- To find the median, the data must first be arranged in ascending order.
- When there are an odd number of values, the median is the middle value.
- When there is an even number of values, the median is the mean of the two middle numbers.
- The median is often preferred when analysing skewed data or datasets with outliers.


What Is the Median?
In statistics, there are various ways to describe the typical value in the dataset. The median is the middle value in an ordered dataset. This means that half the values are lower than the median, and half are higher. The median is considered a measure of central tendency that statisticians use to summarise numbers with a single representative value.¹
The median is useful for data with extreme values or outliers. In real-world datasets, a small number of unusually high or low numbers can distort the mean, making the median a better choice. Since the median uses the position of values rather than their total sum, it's less affected by them.³
In income statistics, a few high salaries can dramatically increase the mean income. The median income is a better indicator of what a typical person owns because it's in the middle of the distribution.⁴
The median is the middle value in an ordered data set. If there is an odd number of values, the central value is the median. If there are an even number of values, the mean is the average of the two middle values.
How to Calculate the Median
To find the median of a dataset, you always start by ordering the values. After that, you need to know whether you have an odd or even number of values, as the middle position will be affected by this. From there, the middle position can be identified and the median determined.²
When a dataset contains an odd number of values, the median is the middle value when the values are arranged in ascending order. The following example shows how the median appears in the centre of an ordered dataset.

| Value | Position |
|---|---|
| 4 | |
| 7 | |
| 9 | |
| 12 | Median |
| 15 | |
| 18 | |
| 21 |
If a dataset contains an even number of values, there is no single middle number. Instead, the median is found by taking the mean of the two middle values once the numbers are ordered.
| Value | Position |
|---|---|
| 5 | |
| 8 | |
| 10 | Middle value |
| 14 | Middle value |
| 17 | |
| 20 |
While the calculation is fairly simple, you have to arrange the data in order before you find the median. If you want extra guidance with problems like these, maths tutoring can help you practise ordering data and identifying the middle position correctly.
Median Formula
With simple examples, it's easy to spot the middle value. However, statisticians can use formulas to identify the median position in larger datasets. Once the data is in ascending order, these formulas can determine where the median lies. In statistics, the number of observations in a dataset is usually represented by  , which is used to locate the middle position.¹
When the dataset contains an odd number of observations, the median corresponds to a single value in the ordered list. The position of this value can be calculated using the following formula:
Median position (odd number of observations):

Median (even number of observations):

Where:
= number of observations in the data set
 = ordered values in the data set
Median in Different Types of Data
In larger datasets, particularly those used in statistics, data may be grouped into class intervals. In these cases, the median is found by using cumulative frequency to identify the class containing the middle value.

| Class Interval | Frequency | Cumulative Frequency |
|---|---|---|
| 0–10 | 4 | 4 |
| 10–20 | 6 | 10 |
| 20–30 | 10 | 20 |
| 30–40 | 5 | 25 |
Once the median class is identified, statisticians can estimate the median more precisely using the grouped data median formula.⁶
Median formula for grouped data:
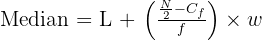
Where:
 = lower boundary of the median class
 = total frequency
 = cumulative frequency before the median class
 = frequency of the median class
 = class width
Real-World Applications of the Median
The median is used in many different fields. Since it provides a clear picture of the dataset's typical value and isn't heavily influenced by large or small outliers, it's great for analysing skewed distributions.³ After all, the median focuses on the middle position.

- Economics: Median income is often used instead of the mean to better represent typical earnings.
- Medicine: The median may describe recovery times or patient survival statistics.
- Sociology: Survey data often uses the median to summarise responses such as age or household income.
Advantages and Limitations of the Median
As with any measure of central tendency, the median has its own strengths and weaknesses. Depending on the type of data being analysed, you may choose the mean or the mode. However, when you have skewed data or outliers, the median is an excellent option.
The median also has limitations. As it considers the middle position, it doesn't account for the magnitude of every value in the dataset. Important information about the data distribution may be lost. For further mathematical calculations or statistical modelling, the mean may be preferred.⁵
The median is especially useful when a data set includes outliers or is skewed. Because it focuses on the middle position rather than the total sum, it is often a better measure of central tendency than the mean in these cases.
Advantages
- Resistant to extreme values or outliers
- Works well with skewed distributions
- Can be used with ordinal data
Limitations
- Does not consider every value in the dataset
- Less useful for further mathematical analysis
- May hide details about data distribution
Common Misconceptions About the Median
While the median is fairly simple, getting it wrong won't give you any useful results. Don't forget that you always have to arrange your data into ascending order before you identify the median. If you don't sort the numbers first, the middle value won't be the median of the dataset.²
Don't confuse the median with the mean, either. The two measure central tendency, but describe data in different ways. With some datasets, the median and mean may be the same, but they don't necessarily offer the same interpretation. In most datasets, however, the two can produce very different results, especially with extreme values.¹
Don't assume that the median must always be one of the numbers in the dataset. When you're dealing with an odd number of observations, it will be. However, for even numbers of observations, you'll find that the median may be a value that doesn't appear in the dataset itself.²
Mean
- The arithmetic average of all values in a dataset.
- Calculated by adding all numbers and dividing by the total number of observations.
- Sensitive to outliers or extreme values.
- Often used when data is symmetrical and evenly distributed.
Median
- The middle value of an ordered dataset.
- Found by arranging numbers in ascending order and selecting the centre value.
- If there are two middle numbers, the mean of the two is taken.
- Works well for skewed data or datasets with outliers.
Mode
- The value that appears most frequently in a dataset.
- A dataset may have one mode, multiple modes, or no mode.
- Often used with categorical or discrete data.
- Helps identify the most common outcome in a dataset.
If you're working through statistics topics like the median and want in-person support, a maths tutor adelaide can help you build confidence with ordering data, interpreting distributions, and applying the median formula correctly.
References
- “Central Tendency: Mean, Median, and Mode.” Khan Academy, https://www.khanacademy.org/math/statistics-probability/summarizing-quantitative-data/central-tendency/v/statistics-intro-mean-median-and-mode. Accessed 14 Mar. 2026.
- “How to Find the Median Value.” Math Is Fun, https://www.mathsisfun.com/median.html. Accessed 14 Mar. 2026.
- “Median.” Encyclopaedia Britannica, https://www.britannica.com/science/median. Accessed 14 Mar. 2026.
- “Median.” Investopedia, https://www.investopedia.com/terms/m/median.asp. Accessed 14 Mar. 2026.
- “Measures of Location.” National Institute of Standards and Technology (NIST) Engineering Statistics Handbook, https://www.itl.nist.gov/div898/handbook/eda/section3/eda351.htm. Accessed 14 Mar. 2026.
- “Measures of the Center of the Data.” OpenStax Introductory Statistics 2e, https://openstax.org/books/introductory-statistics-2e/pages/2-5-measures-of-the-center-of-the-data. Accessed 14 Mar. 2026.
Summarise with AI:
Did you like this article? Leave a rating!


