

In statistics, the mean is one way to find the average, or central tendency, of a dataset. It's often the most commonly used type of average we learn about, and it can be very useful. Here, we'll explain everything you need to know about it.
Key Takeaways
- The mean in statistics is the average value of a dataset and a key measure of central tendency.
- The mean helps summarise large datasets with a single representative value.
- Other measures of central tendency include the median and mode, which may be more suitable for skewed data.
- The mean is widely used in economics, education, science, and statistical analysis.


What is the Mean in Statistics?
In statistics, the mean is one of the most common ways to find the average value within a data set.⁵ This is known as a measure of central tendency, which basically means it creates a central or typical value from a group of numbers. When people talk about the "average", they are often (but not always) referring to the arithmetic mean.¹
Imagine some students in a class get the following scores on their test: 70, 75, 80, 85, and 90. Generally, how did the students do? Using the mean, we can obtain a single value that represents the class’s average result.⁴

The mean includes and uses every value in the dataset, producing a balanced summary of the data. However, it means it can be influenced by unusually high or low values, which can act as outliers. Be sure to understand how the mean works and when it's appropriate to use it, as it's an important part of learning to interpret data in mathematics and statistics.⁶
How to Calculate the Mean
You can calculate the mean by combining all the values in a data set. You then divide this total by the number of values in the dataset. The mean allows you to summarise the dataset with a single number representative of the overall trend of the data. This is useful for large datasets when you can't examine each value individually.³
Try it with our earlier example of students' test results (70, 75, 80, 85, and 90). Using the mean, you can combine the numbers, divide by 5 (since there are 5 results), and get the average score for the class. Try it for yourself. By adding all the scores together and dividing by the number of students, you'll get the mean.
Step 1
Add all the values together.
In this example: 70 + 75 + 80 + 85 + 90 = 400
Step 2
Divide the total by the number of values in the dataset.
Since there are five scores, divide 400 by 5.
Step 3
Calculate the result.
The answer is 80, which represents the class's mean score.
Step 4
Interpret the result.
The mean helps us quickly understand the general level of performance in the dataset. Instead of looking at five separate scores, we can summarise the class’s performance with a single value.
Types of Means in Statistics
The arithmetic mean is the most common type of mean, but it's not the only way to calculate the mean. Each method is a measure of central tendency. Still, they can be used in different types of data and statistical situations.² If you’d like extra support practising these ideas, working with a maths tutor adelaide can help you build confidence with averages and other key concepts.
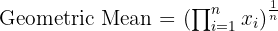
The arithmetic mean is the type we saw before and is the most common method. However, the geometric mean is often used for datasets that involve growth rates, percentages, or multiplicative relationships.
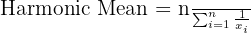
The harmonic mean is a specialised mean used for rates or ratios. It's useful for calculations that involve speed, density, or price per unit. The harmonic mean in these instances provides a more accurate representation of the dataset.
Mean vs. Median vs. Mode
For most mathematical introductions to averages, you'll cover the most common measures of central tendency: the mean, median, and mode. Each has its pros and cons, and while they all help describe the centre of a dataset, they're calculated differently, can yield different results, and offer different interpretations of the data. Here's how they differ.

Mean
- Calculated by adding all values in a dataset and dividing by the total number of values
- Uses every value in the dataset
- Represents the overall average of the data
- Works best for symmetrical distributions without extreme outliers
- Can be skewed by unusually high or low values
Median
- The middle value when the dataset is arranged in numerical order
- Divides the dataset into two equal halves
- Less affected by extreme values or outliers
- Often used for income, house prices, and other skewed data
- Provides a better measure of central tendency in skewed distributions
Mode
- The most frequently occurring value in a dataset
- A dataset can have one mode, multiple modes, or no mode
- Particularly useful for categorical or grouped data
- Helps identify the most common or typical value
- Often used in market research, surveys, and demographic data

Applications of the Mean in Real Life
The mean is very useful in many situations where large datasets can be summarised accurately with a single value. In fields where large amounts of numerical information need to be interpreted efficiently, the mean is an important tool.⁴ For example, economists can use the mean to analyse income levels, inflation, and other economic indicators. Teachers can use examples like our earlier one to see, in general, how students perform on a test. There are many useful applications of the mean. However, some limitations need to be understood. If you're practising these skills and looking for extra help, options such as maths tutoring near me can make it easier to apply averages to real-world problems.
Limitations of the Mean
Before you apply the mean to your datasets, remember that it mightn't be the best measure of central tendency. Extreme values or outliers can affect it. With skewed distributions, it's better to use the median, which focuses on the middle value, which helps reduce the impact of extreme observations.⁷
Take this silly example of where the mean isn't useful. If we assume a 50/50 population split of males and females, the average person has 1 ovary. As you can see here, this is the central tendency using the mean, but it literally tells us nothing about people.

References
- Beyer, Andrew. “Measures of Central Tendency.” Open Maricopa Statistics Textbook, 2021, https://open.maricopa.edu/psy230mm/chapter/chapter-4-measures-of-central-tendency/. Accessed 14 Mar. 2026.
- Green, Keith. “Definitions and Formulas: Arithmetic Mean.” St. John Fisher College Mathematics Text, https://citadel.sjfc.edu/faculty/kgreen/MSTI130/MSTI130Text/Text_Fall_2014su13.html. Accessed 14 Mar. 2026.
- Open University. “The Arithmetic Mean.” OpenLearn, https://www.open.edu/openlearn/science-maths-technology/prices-location-and-spread/content-section-3.3. Accessed 14 Mar. 2026.
- Siegle, Del. “Averages.” Educational Research Basics, University of Connecticut, https://researchbasics.education.uconn.edu/averages/. Accessed 14 Mar. 2026.
- Stark, Philip B. “Glossary of Statistical Terms.” University of California, Berkeley Statistics, https://www.stat.berkeley.edu/~stark/SticiGui/Text/gloss.htm. Accessed 14 Mar. 2026.
- Toggerson, Kristin. “Means and Other Measures of Center.” UMass Open Books Statistics, https://openbooks.library.umass.edu/toggerson-131/back-matter/appendix-k-means-averages-and-other-measures-of-center/. Accessed 14 Mar. 2026.
- University of Nebraska–Lincoln. “Mean and Median.” Contemporary Mathematics Open Textbook, https://mathbooks.unl.edu/Contemporary/sec-2-2-mean-and-median.html. Accessed 14 Mar. 2026.
Summarise with AI:
Did you like this article? Leave a rating!


