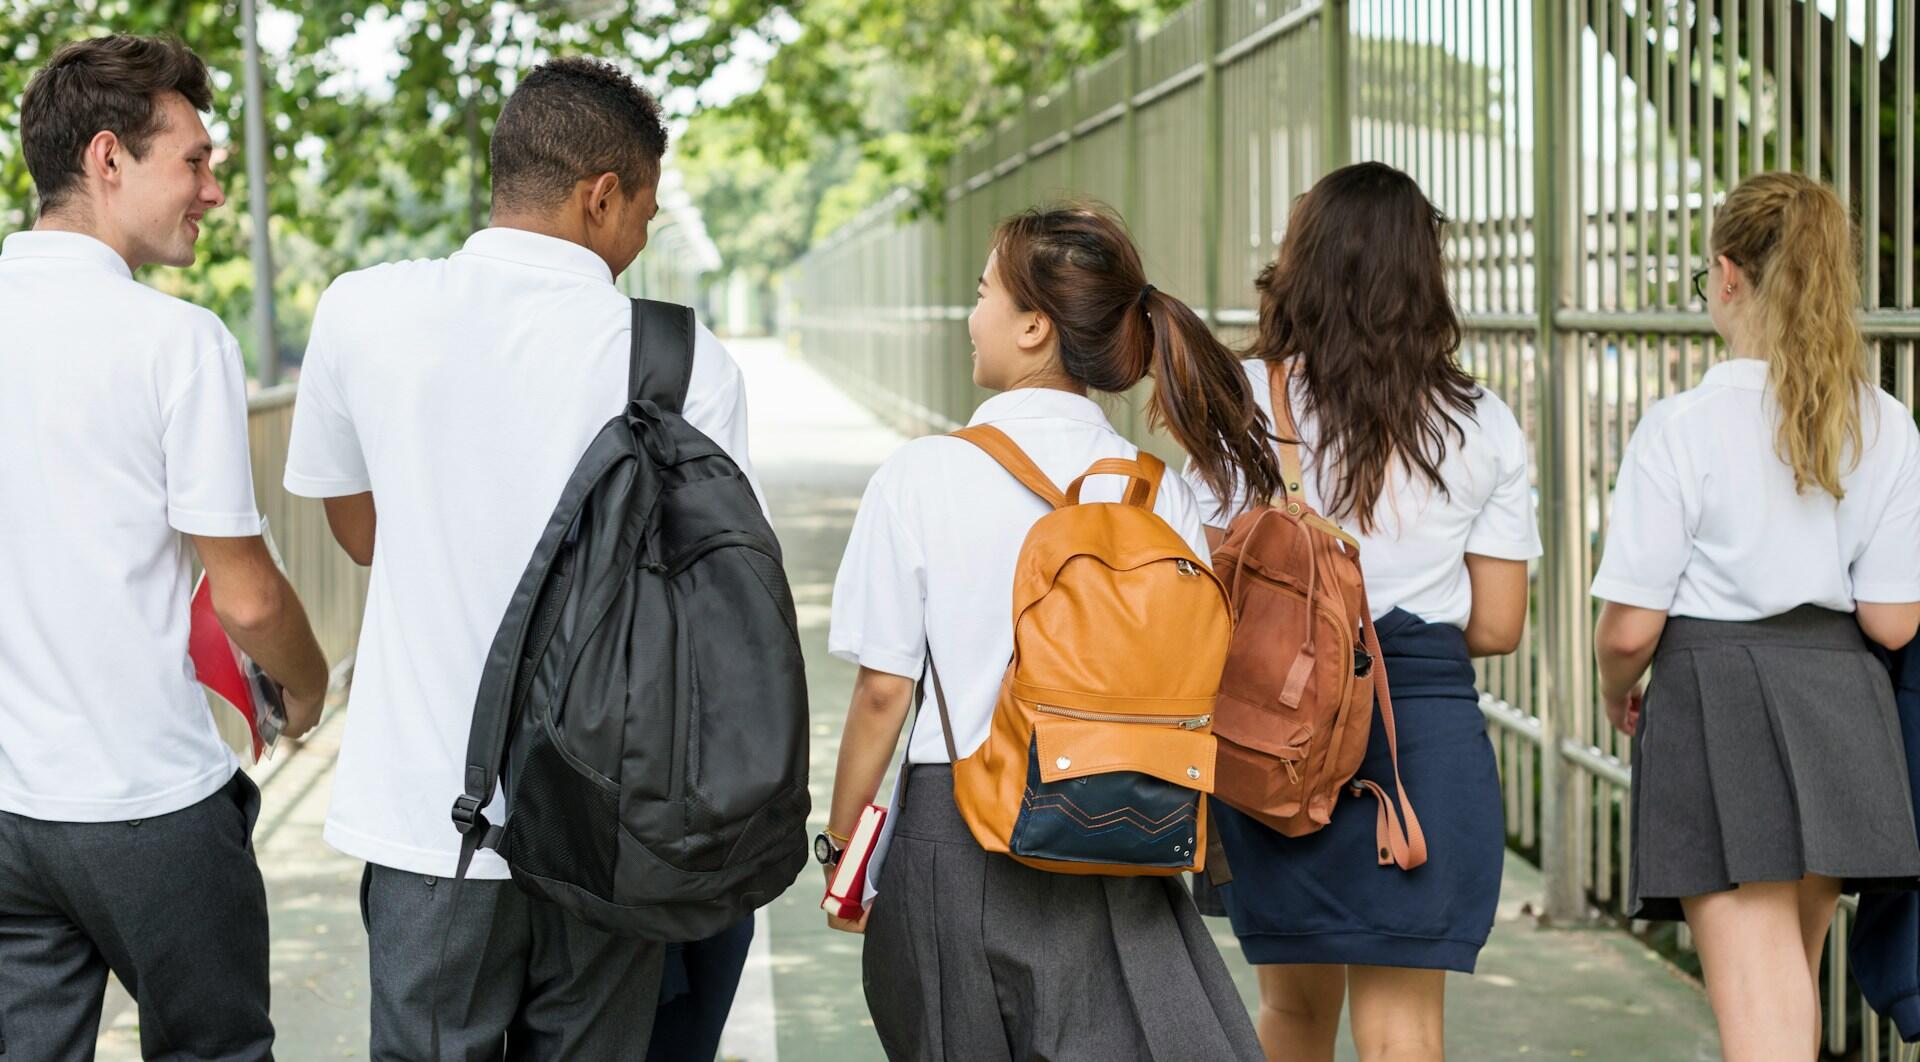

Every three years, the OECD’s Programme for International Student Assessment (PISA) measures how well 15-year-old students can apply what they know in science, reading and maths to real-world problems.
The short version
- 01Australian 15-year-olds score above the OECD average in science, reading and maths.
- 02Over ten years, Australia has been broadly stable in science, while reading and maths have declined.
- 03Students with an immigrant background averaged 6 points higher in science than non-immigrant students.
- 0485% of students attend schools where phones are not allowed, while 68.3% report learning how to assess AI-generated information.
- 05Girls are ahead by 31 points in reading, while boys are ahead by 16 points in maths.
The PISA 2025 results for Australia were released on 8 September 2026, based on 14,658 Australian students from 766 schools. At first glance, the results look reassuring: Australian 15-year-olds remain above the OECD average in science, reading and maths, while also performing strongly in computational problem solving.
But the longer-term trend is less positive. Reading and maths have fallen to their lowest PISA scores recorded for Australia, while science has remained broadly stable — leaving Australia with a strong international position, but weaker results than in the past.


Where Australia stands, subject by subject
PISA scores are not percentages or school marks. They sit on a statistical scale that allows education systems to be compared over time and with one another.
In 2025, Australia scored above the OECD average in all three traditional domains: science, reading and maths. The 2025 cycle also introduced Learning in the Digital World, including a computational problem-solving assessment.
The scores place Australia among the stronger-performing education systems internationally. But the four results also tell slightly different stories:
- Science is Australia’s strongest traditional domain, at 509 points.
- Reading remains above the OECD average, despite falling to 491.
- Maths has the weakest Australian score of the three, at 478, but still sits above the OECD average.
International rankings are useful shorthand, but they should not be read like a precise sporting ladder. Small differences between neighbouring countries and economies are not always statistically significant.
Science was the main assessment domain in PISA 2025, so it provides the deepest picture of Australian student performance.
Science
Where Australia sits on the scale
Australia scores 27 points above the OECD average in science. Science was the main assessment domain in PISA 2025.
Around 82% of Australian students reached at least Level 2 in science, compared with 74% across the OECD. At the top end, 12% reached Level 5 or 6, compared with 7% OECD-wide.
That makes Australia’s science result relatively strong internationally. But comparing Australia with other countries is only part of the story.
Australia is still above average, but reading and maths are at record lows
To understand the direction of Australian education, it is more useful to compare Australia with itself over time.
Over the decade from 2015 to 2025, science was broadly stable. Reading and maths moved in the opposite direction.
Ten years on
Change between 2015 and 2025
Science
Reading
Maths
Bars show falls; a score that rose or held steady has no bar. Source: OECD, PISA 2025.
The key contrast: Australia remains above the OECD average partly because other OECD systems have also declined. That does not cancel out Australia’s own fall in reading and maths.
The longer historical series is even more striking. The OECD reports that Australia’s 2025 reading and maths results are the lowest ever measured for the country in PISA.
Reading
down 37 points from Australia’s 2000 result.
Maths
down 46 points from 2003.
Science
comparatively stable over the past decade.
The OECD describes Australia’s 2025 reading and mathematics results as the lowest ever measured for the country in PISA.
This does not mean Australia has suddenly become a below-average education system. It means Australia can simultaneously perform relatively well internationally and still be moving in the wrong direction compared with its own past results.
When comparing countries, there is also an important technical detail to keep in mind.
Why Australia has no asterisk — and why that matters
Some countries are marked with an asterisk in the OECD tables because one or more PISA sampling standards were not fully met. Australia does not carry that sampling caveat in PISA 2025. Comparisons with starred systems should therefore be interpreted with additional care, particularly when score differences are small.
PISA is based on representative samples rather than every 15-year-old student in a country. The OECD therefore publishes quality and sampling information alongside the scores, and comparisons involving systems with sampling caveats deserve extra care.
Science held steady — but the average hides movement at both ends
A stable national average can hide what is happening among lower- and higher-performing students.
Between 2022 and 2025, the share of Australian students below Level 2 in science fell slightly. At the same time, the share reaching the highest proficiency levels also fell slightly.
Change in the share of Australian students below Level 2 in science since 2022.
Change in the share reaching Levels 5 or 6 in science over the same period.
These are small movements, so they should not be exaggerated. The broader picture is that Australia still has a larger share of students reaching both baseline and top-level science proficiency than the OECD average, but there is no evidence here of a broad improvement across the whole performance distribution.
Family background: one surprising result and one stubborn gap
One of the more unusual Australian findings appears when science performance is compared by immigrant background.
Students with an immigrant background averaged slightly higher science scores than non-immigrant students, whereas the raw OECD-wide pattern runs in the opposite direction.
+6 points
Students with an immigrant background averaged 6 points higher in science than non-immigrant students. Across the OECD, the raw gap runs 43 points in the opposite direction. This is a group-level comparison and does not show that immigrant background itself causes higher performance.
How should we interpret that result?
What the data shows
- The direction of the Australian gap differs from the overall OECD pattern.
- Australian students with an immigrant background recorded a slightly higher average science score.
What the data does not show
- That having an immigrant background itself causes higher academic performance.
- That all students within either group have similar experiences or results.
- Which individual family, language, demographic or educational factors explain the difference.
PISA reports averages across large groups. Many factors can sit behind those averages, so the six-point difference is better treated as an interesting pattern than as a causal conclusion.
Socio-economic background, meanwhile, remains strongly associated with achievement.
Who gets left behind
Science score gap between the most and least advantaged quarter of students
A smaller number means a narrower achievement gap between socio-economic groups. Socio-economic status explains 9.5% of the variation in Australian science results, against 11.6% across the OECD. 13.2% of disadvantaged students still reach the top quarter of science performance, against 11.9% OECD-wide.
Australia’s gap between the most and least advantaged quarter of students is slightly narrower than the OECD average, but that should not automatically be read as a story of improvement for disadvantaged students.
Over the longer period from 2015 to 2025, the gap narrowed partly because performance among advantaged Australian students declined while performance among disadvantaged students remained broadly stable.
Girls and boys: the gap depends on the subject
There is no single gender gap in Australia’s PISA results.
In science, girls and boys perform almost identically. In reading, girls are substantially ahead. In maths, boys are ahead.
Girls and boys
Who is ahead, and by how much
Science
Reading
Maths
A negative number means girls are ahead; a positive number means boys are ahead.
These figures describe population averages, not individual ability. They should not be used to assume that a particular boy will struggle with reading or a particular girl with maths.
What they do show is that the national pattern differs sharply by subject, which is useful context for schools, families and anyone supporting students’ confidence and participation.
Australia has widespread phone bans — but digital distraction is still high
Australia is an interesting case in the debate about technology in schools.
Mobile phone restrictions are now widespread, and Australian students also report relatively high levels of AI use and AI literacy. Yet digital distraction in lessons remains common.
Of Australian students are in schools where phones are not allowed. The OECD average is 49.5%.
Are taught in class how to judge whether AI-generated information is true. The OECD average is 62.6%.
Use AI at least weekly to help them learn, against 45.5% across the OECD.
Report no distraction from digital devices in lessons, against 39.2% OECD-wide.
Three figures capture the tension particularly clearly:
- 85.3% attend schools where phones are not allowed.
- 39% say peers are regularly distracted by digital devices in science lessons.
- Australian students use digital devices for learning for 2.6 hours per school day, versus 1.7 hours OECD-wide.
Australian students reported spending an average of 2.6 hours per day using digital devices at school for learning activities, compared with 1.7 hours across the OECD.
At the same time, 39% said their peers were often distracted by digital devices during most or all science lessons, compared with 28% OECD-wide.
That makes the Australian picture more complicated than “screens are good” or “screens are bad”. PISA shows associations between digital use, school rules, distraction and performance, but it does not establish a simple cause-and-effect relationship.
The more useful distinction is between purposeful use, excessive or distracting use, and whether students are being taught to evaluate what digital tools — including AI — produce.
Supportive teachers, but school life still has warning signs
Australian students generally report strong support from their science teachers.
Around 79% say their teacher shows an interest in every student’s learning, while 80% say their teacher gives extra help when needed. Both figures are above the OECD average.
But other indicators of school experience are less positive.
Report experiencing at least one form of bullying a few times per month or more. OECD average: 20%.
Say they feel they belong at school. OECD average: 76.2%.
Say their science teacher gives extra help when needed. OECD average: 73%.
Say noise and disorder disrupt most or every science lesson. OECD average: 31%.
Attendance is another warning sign
OECD average: 22%
That does not mean absenteeism alone explains Australia’s PISA performance. The assessment cannot establish that kind of direct cause and effect.
It does, however, add important context. Academic results do not exist separately from students’ everyday experience of school.
Classroom behaviour, relationships with teachers, attendance, bullying and whether students feel that they belong can all shape the environment in which learning takes place.
One Australian score, eight state and territory stories
PISA publishes a national Australian result, but education is delivered through states and territories, and the national average hides substantial variation between jurisdictions.
| State or territory | PISA 2025 picture |
|---|---|
| ACT | Highest Australian results across all four reported domains: science 537, reading 517, maths 502 and digital learning 547 |
| Victoria | Above the OECD average across all reported domains |
| Western Australia | Above the OECD average across all reported domains |
| New South Wales | Above the OECD average across all reported domains |
| Queensland | Above OECD average in science and reading; around the OECD average in maths |
| South Australia | Above OECD average in science and reading; around the OECD average in maths |
| Tasmania | Among the lower Australian averages; generally around the OECD average |
| Northern Territory | Among the lower Australian averages; generally around the OECD average |
The Australian Capital Territory stood out, recording Australia’s highest results across science, reading, maths and Learning in the Digital World.
Victoria, Western Australia and New South Wales also performed above the OECD average across the reported domains, while Queensland and South Australia were above average in science and reading and around the OECD average in maths.
Tasmania and the Northern Territory recorded the lowest Australian averages.
These figures compare jurisdictions, not individual schools. Differences between state and territory averages can reflect student background, geography, population composition and other factors as well as differences in education systems.
For that reason, the results are more useful for identifying broad patterns than for constructing a simple “best to worst” ranking of Australian school systems.
Five things the data actually supports
PISA cannot tell parents or students exactly what to do next, and it cannot prove that one particular habit causes a particular score.
It can, however, highlight patterns that are useful when thinking about learning, study habits and students’ experience of school.
Teach them to question the chatbot
68.3% of Australian students report learning how to assess AI-generated information in class, against 62.6% across the OECD. The useful habit is not simply using AI, but checking sources, evidence and whether an answer makes sense.
Focus on effective study, not just more hours
PISA finds that the relationship between study time and performance is not simply “more is better”. Treat time-on-task as one signal, and focus on whether the student actually understands the work.
Protect sustained reading
Australia’s reading result is the lowest recorded for the country in PISA. Regular reading that requires concentration remains a useful habit well beyond English class.
Ask about school life, not just grades
23% of Australian students report experiencing at least one form of bullying a few times per month or more, compared with 20% across the OECD. School experience matters alongside academic performance.
Encourage them to ask for help
82% of Australian students say they ask teachers for help when they need it. PISA finds help-seeking is positively associated with science performance after accounting for socio-economic background.
Compare the countries you care about
Tick up to six countries in the list to compare them across the four subjects. Australia is selected by default.
PISA 2025: compare countries
Tick up to six countries to compare them across the four subjects assessed. United Kingdom is selected by default.
| Rank | Country | Science | Since 2022 | ||
|---|---|---|---|---|---|
| 1 | B-S-J-Z (China) | 597 | — | ||
| 2 | Singapore | 560 | −2 | ||
| 3 | Macao (China) | 541 | −2 | ||
| 4 | Chinese Taipei | 540 | +2 | ||
| 5 | Japan | 538 | −9 | ||
| 6 | Estonia | 527 | +1 | ||
| 7 | Korea | 526 | −2 | ||
| 8 | United Kingdom | 511 | +12 | ||
| 9 | Canada* | 510 | −5 | ||
| 10 | New Zealand* | 509 | +5 | ||
| 11 | Australia | 509 | +2 | ||
| 12 | Finland | 504 | −7 | ||
| 13 | United States* | 502 | +2 | ||
| 14 | Switzerland | 501 | −1 | ||
| 15 | Ireland | 500 | −4 | ||
| 16 | Austria | 497 | +6 | ||
| 17 | Hong Kong (China) | 496 | −25 | ||
| 18 | Poland | 495 | −4 | ||
| 19 | Türkiye | 494 | +18 | ||
| 20 | Czechia | 490 | −7 | ||
| 21 | Belgium | 490 | −1 | ||
| 22 | Lithuania | 488 | +3 | ||
| 23 | Germany | 486 | −7 | ||
| 24 | Netherlands* | 485 | −3 | ||
| 25 | Sweden | 485 | −8 | ||
| 26 | Slovenia | 484 | −16 | ||
| 27 | France | 483 | −4 | ||
| 28 | Italy | 483 | +6 | ||
| 29 | Portugal | 482 | −3 | ||
| — | OECD average | 482 | −3 | ||
| 30 | Hungary | 480 | −6 | ||
| 31 | Denmark | 478 | −16 | ||
| 32 | Spain | 477 | −7 | ||
| 33 | Croatia | 476 | −6 | ||
| 34 | Slovak Republic | 475 | +13 | ||
| 35 | Luxembourg | 474 | — | ||
| 36 | Norway* | 470 | −8 | ||
| 37 | Latvia | 468 | −25 | ||
| 38 | United Arab Emirates | 458 | +26 | ||
| 39 | Viet Nam | 457 | — | ||
| 40 | Malta | 453 | −13 | ||
| 41 | Ukrainian regions (17 of 27) | 448 | −1 | ||
| 42 | Uruguay | 445 | +9 | ||
| 43 | Chile | 442 | −1 | ||
| 44 | Israel | 442 | −23 | ||
| 45 | Iceland | 441 | −6 | ||
| 46 | Brunei Darussalam | 439 | −6 | ||
| 47 | Mauritius | 438 | — | ||
| 48 | Uzbekistan | 438 | +83 | ||
| 49 | Montenegro | 435 | +32 | ||
| 50 | Albania* | 435 | — | ||
| 51 | Qatar | 434 | +2 | ||
| 52 | Greece | 434 | −7 | ||
| 53 | Thailand | 432 | +23 | ||
| 54 | Serbia | 429 | −18 | ||
| 55 | Romania | 425 | −3 | ||
| 56 | Mongolia | 424 | +12 | ||
| 57 | Costa Rica | 424 | +13 | ||
| 58 | Georgia | 422 | +38 | ||
| 59 | Moldova | 422 | +5 | ||
| 60 | Bulgaria | 421 | 0 | ||
| 61 | Kazakhstan | 420 | −4 | ||
| 62 | Malaysia | 419 | +3 | ||
| 63 | Colombia | 414 | +3 | ||
| 64 | Mexico | 414 | +4 | ||
| 65 | Saudi Arabia | 413 | +23 | ||
| 66 | Cyprus | 411 | 0 | ||
| 67 | Azerbaijan | 409 | — | ||
| 68 | Brazil | 409 | +6 | ||
| 69 | Jordan | 407 | +32 | ||
| 70 | Peru | 406 | −2 | ||
| 71 | Ecuador | 393 | — | ||
| 72 | Argentina | 393 | −13 | ||
| 73 | Indonesia | 389 | +6 | ||
| 74 | El Salvador | 385 | +12 | ||
| 75 | Cambodia | 382 | +35 | ||
| 76 | North Macedonia | 378 | −1 | ||
| 77 | Philippines | 373 | +17 | ||
| 78 | Lebanon | 372 | — | ||
| 79 | Armenia | 369 | — | ||
| 80 | Kyrgyzstan | 363 | — | ||
| 81 | Dominican Republic | 361 | 0 | ||
| 82 | Palestinian Authority | 359 | −17 | ||
| 83 | Morocco | 358 | −7 | ||
| 84 | Kosovo | 357 | 0 | ||
| 85 | Paraguay | 355 | −13 | ||
| 86 | Kurdistan Region (Iraq) | 352 | — | ||
| 87 | Guatemala | 351 | −22 | ||
| 88 | Zambia | 337 | — | ||
| 89 | Kenya | 335 | — | ||
| 90 | Dushanbe (Tajikistan) | 334 | — | ||
| 91 | Rwanda | 317 | — |
What PISA can — and cannot — tell us
PISA is designed to compare education systems, not to grade individual schools or students.
Australian participants are a representative sample of 15-year-olds. The assessment does not count towards their school grades, and its questions are designed to test how students apply knowledge and reasoning rather than how closely they have memorised one particular Australian curriculum.
That makes the results valuable — but only when they are interpreted within those limits.
What PISA can tell us
- How Australian 15-year-olds perform compared with other education systems
- How Australian results have changed over time
- Differences between broad student groups
- Patterns in school experience, digital use and learning
- Areas where Australia performs relatively strongly or weakly
What PISA cannot tell us
- Whether one factor directly caused a particular score
- Which individual schools are “best” or “worst”
- How capable an individual student is
- Whether a small ranking difference between two countries is meaningful
- How closely students have mastered one specific Australian curriculum
So, what is the fairest conclusion?
Science has been considerably steadier, while computational problem solving is an emerging Australian strength.
At the same time, the 2025 results point beyond academic scores. Socio-economic inequality remains visible, classroom disruption is relatively common, attendance is a concern and many students report experiences of bullying or weaker school belonging.
Taken together, the results present neither a crisis nor an uncomplicated success story. Australia still performs well against many comparable education systems, but its strongest international rankings should not distract from the areas where student outcomes have deteriorated over time.
Source
OECD (2026), PISA 2025 Results (Volume I), OECD Publishing, Paris. doi.org/10.1787/73451bc5-en
Who sits the test
15-year-olds chosen at random. The result does not count towards their school grades.
Reading the scores
The PISA scale was originally centred around 500 points. Current OECD averages vary by subject, and very small differences between neighbouring systems are not always statistically meaningful.
Still to come
PISA 2025 reporting continues beyond this first release, including further analysis of students’ self-directed learning in a digital environment in 2027.
References
- OECD, PISA 2025 Results (Volume I): Australia — Country Note (2026). Australian scores and long-term trends, proficiency levels, socio-economic and gender gaps, immigrant background, school experience, phone policies, AI use and sampling quality. https://www.oecd.org/content/dam/oecd/en/publications/reports/2026/09/pisa-2025-results-volume-i-country-notes_88d1164e/australia_5b8914da/20d725d6-en.pdf
- OECD, PISA 2025 Results (Volume I): Future-Ready Students (2026). International PISA results, OECD averages, country comparisons, computational problem solving, methodology and international data tables. https://www.oecd.org/en/publications/pisa-2025-results-volume-i_73451bc5-en.html
- Australian Council for Educational Research (ACER), PISA in Brief Australia 2025: Student Performance (2026). Summary of Australian performance in science, reading, maths and Learning in the Digital World, including trends and differences by state, territory and student group. https://research.acer.edu.au/ozpisa/68/
- Australian Council for Educational Research (ACER), PISA Reports and Data (2026). Australian PISA 2025 reports, including the full Volume I student performance report, the PISA in Brief report and downloadable Australian data and previous PISA cycles. https://www.acer.org/au/pisa/reports-and-data
- Teacher Magazine / ACER, PISA 2025: Australian Students Perform Above OECD Average in All Domains (2026). Australian results by subject, Learning in the Digital World and comparisons between Australian states and territories. https://www.teachermagazine.com/au_en/articles/pisa-2025-results
Summarise with AI:
Did you like this article? Leave a rating!

 Loading...