
In mathematics and statistics, averages are a way we can make sense of data. They're used to summarise a group of numbers into a single value. The three most common measures are the mean, median, and mode, with each describing a data set in different ways, depending on the kind of data you have and your statistical situation.¹ Here, we'll look at how each is calculated, how they're used, and how you should use them to summarise data effectively.⁵


Definitions of Mean, Median, and Mode
Let's start by defining the three most common measures to describe the centre of a data set (which is effectively what an average is). These values are known as measures of central tendency in maths, since they identify a representative value within a group. Rather than examining every number individually, they allow us to summarise a set of data into a single value that reflects its overall pattern.⁶
Although each method describes the "average" of a data set, because the mean, median, and mode are calculated differently, they can yield different results. The mean uses every value in the data set, the median identifies the middle value in an ordered data set, and the mode selects the most frequently occurring value.⁷
When comparing mean vs median statistics, this is essential. Each measure is better suited to certain types of data. Let's look at each measure individually and how we calculate it in practice.²
Mean
The mean is calculated by adding all the values in a data set and dividing the total by the number of observations. This measure of central tendency uses every value in the data set.
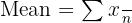
Where:
- ∑x\sum x∑x = sum of all values
- nnn = number of observations

A teacher records the test scores of five students: 6, 7, 8, 8, 9
The mean score of 7.6 gives the teacher a quick idea of the class's overall performance.
The mean is useful when you want a single value representing the average of all results.
Median
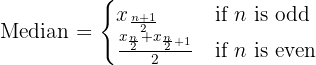
The median is the middle value in an ordered data set. When the number of observations is even, the median is the mean of the two middle values.
A property website lists the prices of five homes in a neighbourhood: €220,000, €240,000, €260,000, €280,000, €950,000
The median price is €260,000, which better represents the typical home price because the very expensive property would distort the mean.
The median is useful when extreme values or outliers appear in the data.
Mode
The mode is the value that appears most frequently in a data set. A distribution can have:
- One mode (unimodal)
- Two modes (bimodal)
- Multiple modes (multimodal)
Unlike the mean and median, the mode can be used with both categorical and non-numeric data.

A café records the number of coffees sold each hour: 12, 15, 15, 17, 20
The mode is 15, indicating that 15 coffees per hour is the most common level of demand.
The mode is useful for identifying the most frequent value in a dataset.
Key Differences Between Mean, Median, and Mode
| Measure | Definition | Sensitive to Outliers | Best Use Case |
|---|---|---|---|
| Mean | Average of all values | Yes | Normally distributed numerical data |
| Median | Middle value in ordered data | No | Skewed distributions |
| Mode | Most frequent value | No | Categorical or repeated data |
Sensitivity to Outliers
Some data sets may include extreme values. These are known as outliers.² They can affect the average, and they affect the different types of averages differently.
Mean
Uses every value in the data set, so extreme values can significantly affect the result. A single unusually high or low number can pull the mean away from the centre of the data.
Median
The median is much less affected by outliers because it only depends on the middle value of the ordered data. Even if a few values are very large or very small, the median will usually remain stable.
Mode
The mode is generally unaffected by outliers because it only identifies the most frequent value. Unless the extreme value appears repeatedly, it will not change the mode.
Applicability to Data Types
The different averages are best applied to different data types.⁷ Some averages need numerical values, while others can be used with categorical data. Choose the right measure depending on the nature of the information you're analysing.²
Mean
The mean can only be used with numerical data because it requires addition and division. It works well for continuous measurements such as heights, temperatures, or exam scores.
Median
The median can be used with numerical or ordered data. It is especially useful when values can be ranked, but the exact distances between them may not matter.
Mode
The mode works with both numerical and categorical data. For example, it can be used to identify the most common product sold, the most popular colour choice, or the most frequent response in a survey.
Use Cases in Real-World Scenarios
All averages are useful, even in real-world scenarios.⁸ Choosing whether you use the mean, median, or mode will depend on what you want to know about your data. Pick the appropriate measure for more accurate conclusions.
Mean
Commonly used for analysing exam results, scientific measurements, and other numerical data where every value contributes to the final average.
Median
Often used in economics and property markets. Median income or median house prices provide a clearer picture when extremely high values might distort the mean.
Mode
Useful in business and marketing. Companies often use the mode to identify the most popular product size, colour, or customer preference.
When to Use Mean vs. Median vs. Mode
In real data analysis, you need to know which measure of central tendency best represents your data.⁵ Choose based on the distribution of data, the presence of outliers, and the type of information you're analysing. You should know how to calculate the mean, median, and mode, and use them effectively.
Choosing the Right Measure Based on Data Characteristics
As we saw earlier, some are better for balanced numerical data, others for extreme values, and others for categorical data.² Remember how to calculate the average and what's best for your data. Your goal is an accurate summary, after all. If you're looking for extra help with these topics, working with a maths tutor adelaide can make the calculations and interpretation much clearer.
Mean
Best used when numerical data are evenly distributed and do not contain extreme outliers. Because it includes all values in the calculation, the mean works well for balanced data, such as exam scores or scientific measurements.
Median
Preferred when a data set contains outliers or is skewed. Since the median depends only on the middle value, it provides a more stable representation of the centre in situations such as income distributions or property prices.
Mode
Most useful when you want to identify the most common value in a data set. It works particularly well for categorical data or repeated observations, such as the most popular product size or survey response.
Practical Examples
With real-world data, you have to choose the average that reflects the situation that you're studying. By highlighting different aspects of the data, each measure allows analysts to compare them. Use the appropriate measure to ensure the average clearly conveys your point.
Mean
A researcher calculating the average exam score for a class may use the mean because every student's score contributes equally to the group's overall performance.
Median
Economists frequently report the median household income because a few extremely high salaries could distort the mean and give a misleading impression of typical earnings.
Mode
Retailers might analyse the most commonly purchased shoe size or clothing size. In this case, the mode identifies the most frequently occurring value and helps guide stock decisions.
Mean, Median, and Mode in Statistical Analysis
Measures of central tendency are key in descriptive statistics as they help analysts summarise large data sets with a single representative value. Rather than examining each individually, they can identify typical or central values. It makes it easier to compare data sets, identify patterns, and communicate statistical results clearly.⁶

Role in Descriptive Statistics
In descriptive statistics, the mean, median, and mode offer different ways to summarise a set of observations. By highlighting slightly different aspects of the data, analysts often compare them to interpret results. Each serves a valuable purpose.
Mean
The mean is widely used in statistical analysis because it incorporates every value in a data set. It is particularly useful for analysing numerical measurements such as test scores, temperatures, or scientific data.
Median
The median provides a stable measure of central tendency when the distribution contains extreme values. Because it focuses on the middle observation, it is commonly used in economic data such as income or house prices.
Mode
The mode identifies the most frequently occurring value in a data set. It is useful when analysing repeated observations or categorical data, such as the most common survey response or product size.
Relationship Between the Measures
In moderately skewed distributions, statisticians can use an empirical relationship between the three averages.³ This allows them to estimate one value from another. It's a simple approximation when the mode is difficult to determine.

Limitations and Considerations
Since the mean, median, and mode are all useful, they also have limitations.⁶ Be aware of them before you apply them to your data. After all, they can largely misrepresent data if used in the wrong situations.
| Measure | Advantages | Disadvantages |
|---|---|---|
| Mean | Uses all values in a data set | Sensitive to outliers |
| Median | Resistant to extreme values | Does not use all data points |
| Mode | Works with categorical data | May not represent the overall distribution |
References
- Beyer, A. Chapter 4: Measures of Central Tendency. Maricopa Open Educational Resources, 2021. https://open.maricopa.edu/psy230mm/chapter/chapter-4-measures-of-central-tendency/. Accessed 14 Mar. 2026.
- Laerd Statistics. Measures of Central Tendency: Mean, Median and Mode. https://statistics.laerd.com/statistical-guides/measures-central-tendency-mean-mode-median.php. Accessed 14 Mar. 2026.
- Manikandan, S. Measures of Central Tendency: The Mean. Journal of Pharmacology and Pharmacotherapeutics, 2011. https://pmc.ncbi.nlm.nih.gov/articles/PMC3127352/. Accessed 14 Mar. 2026.
- Manikandan, S. Measures of Central Tendency: Median and Mode. Journal of Pharmacology and Pharmacotherapeutics, 2011. https://pmc.ncbi.nlm.nih.gov/articles/PMC3157145/. Accessed 14 Mar. 2026.
- Pennsylvania State University. STAT 200: Measures of Central Tendency. https://online.stat.psu.edu/stat200/lesson/2/2.2/2.2.4. Accessed 14 Mar. 2026.
- Purdue Online Writing Lab. Descriptive Statistics. https://owl.purdue.edu/owl/research_and_citation/using_research/writing_with_statistics/descriptive_statistics.html. Accessed 14 Mar. 2026.
- Scribbr. Central Tendency: Understanding the Mean, Median, and Mode. https://www.scribbr.com/statistics/central-tendency/. Accessed 14 Mar. 2026.
- Statistics By Jim. Measures of Central Tendency: Mean, Median, and Mode. https://statisticsbyjim.com/basics/measures-central-tendency-mean-median-mode/. Accessed 14 Mar. 2026.
- University of Pittsburgh. Central Tendency. https://sites.pitt.edu/~fass/cent.html. Accessed 14 Mar. 2026.
Summarise with AI:
Did you like this article? Leave a rating!