
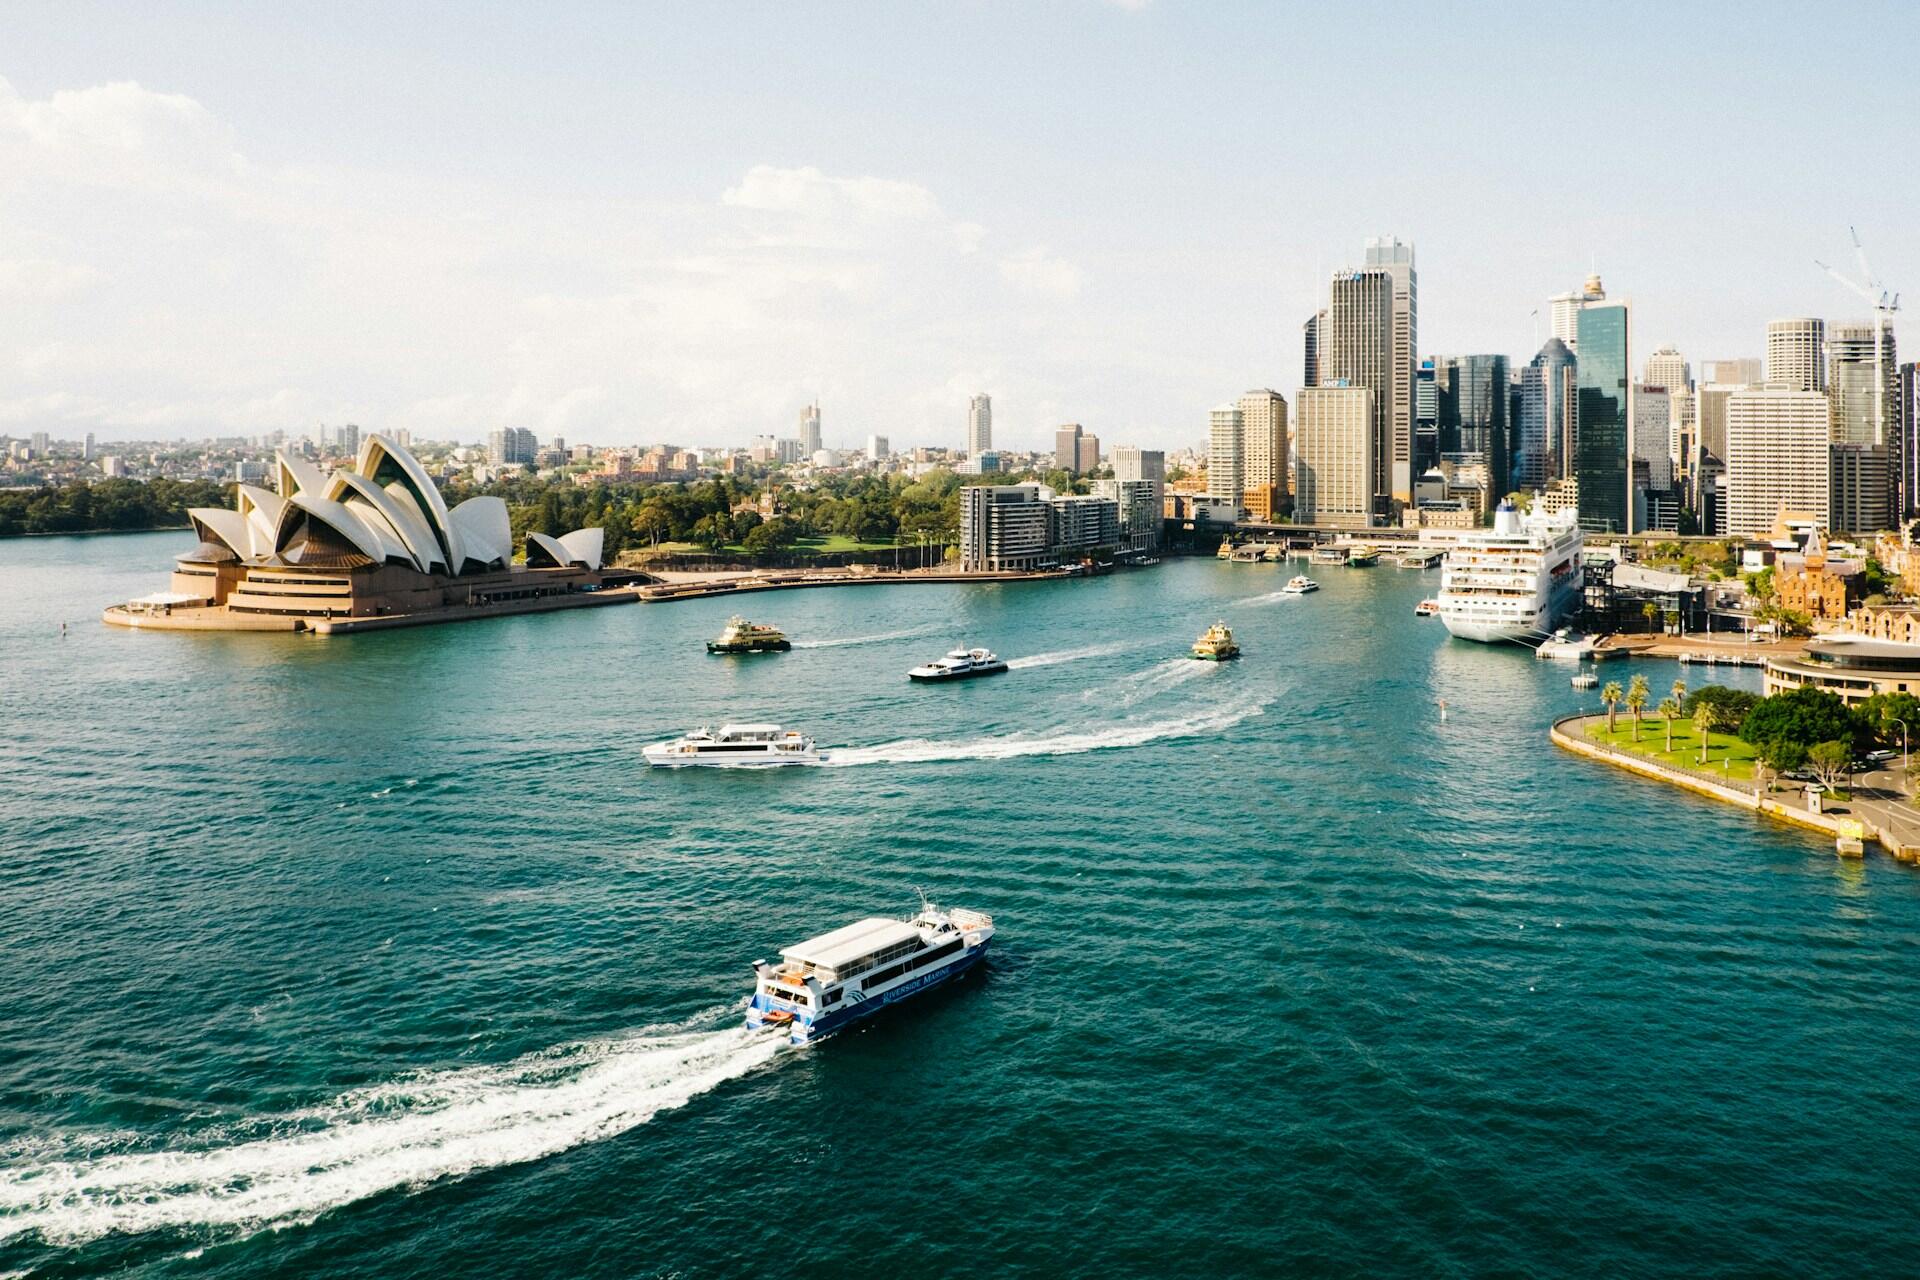

Australia is a big place, but when it comes to where Australians live, population data and ABS statistics show the population is anything but evenly distributed across the country. Approximately 80% of Australians reside within 25 km of the coast, primarily in major urban centres, due to favourable climate, economic opportunities, and historical settlement patterns. This guide uses population data and national statistics to explain where people live across Australia's states and territories and why the population is distributed in this way.
Key Takeaways
- Around 80% of Australians live within 25 km of the coast²
- Australia’s population is concentrated in a small number of major cities¹
- About 73% of people live in major urban centres⁵
- Roughly 96% of Australians live in urban areas²
- Inland regions have very low population density due to environmental conditions²
- Coastal cities dominate economic activity and population growth⁴
- Future population growth is expected to remain focused in major cities³





Overview of Australia's Population Distribution
An interesting thing about Australia is that across its states and territories, population distribution is uneven. Population data from national census sources show that most people are concentrated in a small number of coastal and regional areas. Inland and regional areas, particularly in northern and western Australia and parts of the south, are very sparsely populated. This is the result of long-term settlement trends and environmental constraints that still shape where Australians live today.²
Australia's population is highly concentrated despite its large size. Most people live in coastal cities, while vast inland areas remain sparsely populated due to arid conditions, limited water access, and fewer economic opportunities.
When you start looking at the national figures and regional density, you'll get a clearer picture of how uneven this all is. Population totals for coastal states continue to grow. If you look at density figures, you'll see how little of Australia's land is heavily populated. Coastal Australia and inland Australia are two very different places.¹
live within 25 km of the coast.
Population Density Across Regions
| Region | Area (km²) | Population | Density (people per km²) |
|---|---|---|---|
| New South Wales | 809000 | 8300000 | 10.3 |
| Victoria | 227000 | 6900000 | 30.4 |
| Queensland | 1853000 | 5600000 | 3.0 |
| Western Australia | 2529000 | 2900000 | 1.1 |
| South Australia | 983000 | 1900000 | 1.9 |
| Tasmania | 68000 | 575000 | 8.5 |
| Australian Capital Territory | 2358 | 460000 | 195.1 |
| Northern Territory | 1349000 | 250000 | 0.2 |
live in urban areas such as cities, towns, and settlements.
Coastal vs. Interior Settlement Patterns
As the data shows, most people in Australia live in coastal regions, while inland areas across the Northern Territory and central regions remain sparsely populated. The interior is sparsely populated because of environmental and economic factors, although Indigenous and Aboriginal communities remain present across many remote regions. You can see the contrast both in long-term settlement patterns and differences in access to resources and infrastructure.⁷
Coastal areas in Australia offer milder climates, better access to water, and stronger job markets. These regions also developed first during European settlement, which shaped long-term population patterns that still influence where people live today.
Predominance of Coastal Living
Most Australians live in the coastal regions. You'll find the most densely populated areas on the eastern and southeastern seaboard. These areas are home to the largest cities and most of the economic activity. In turn, this attracts population growth. While these areas were settled early in Australia's colonisation, the patterns have persisted over time.⁴
Challenges of Inland Settlement
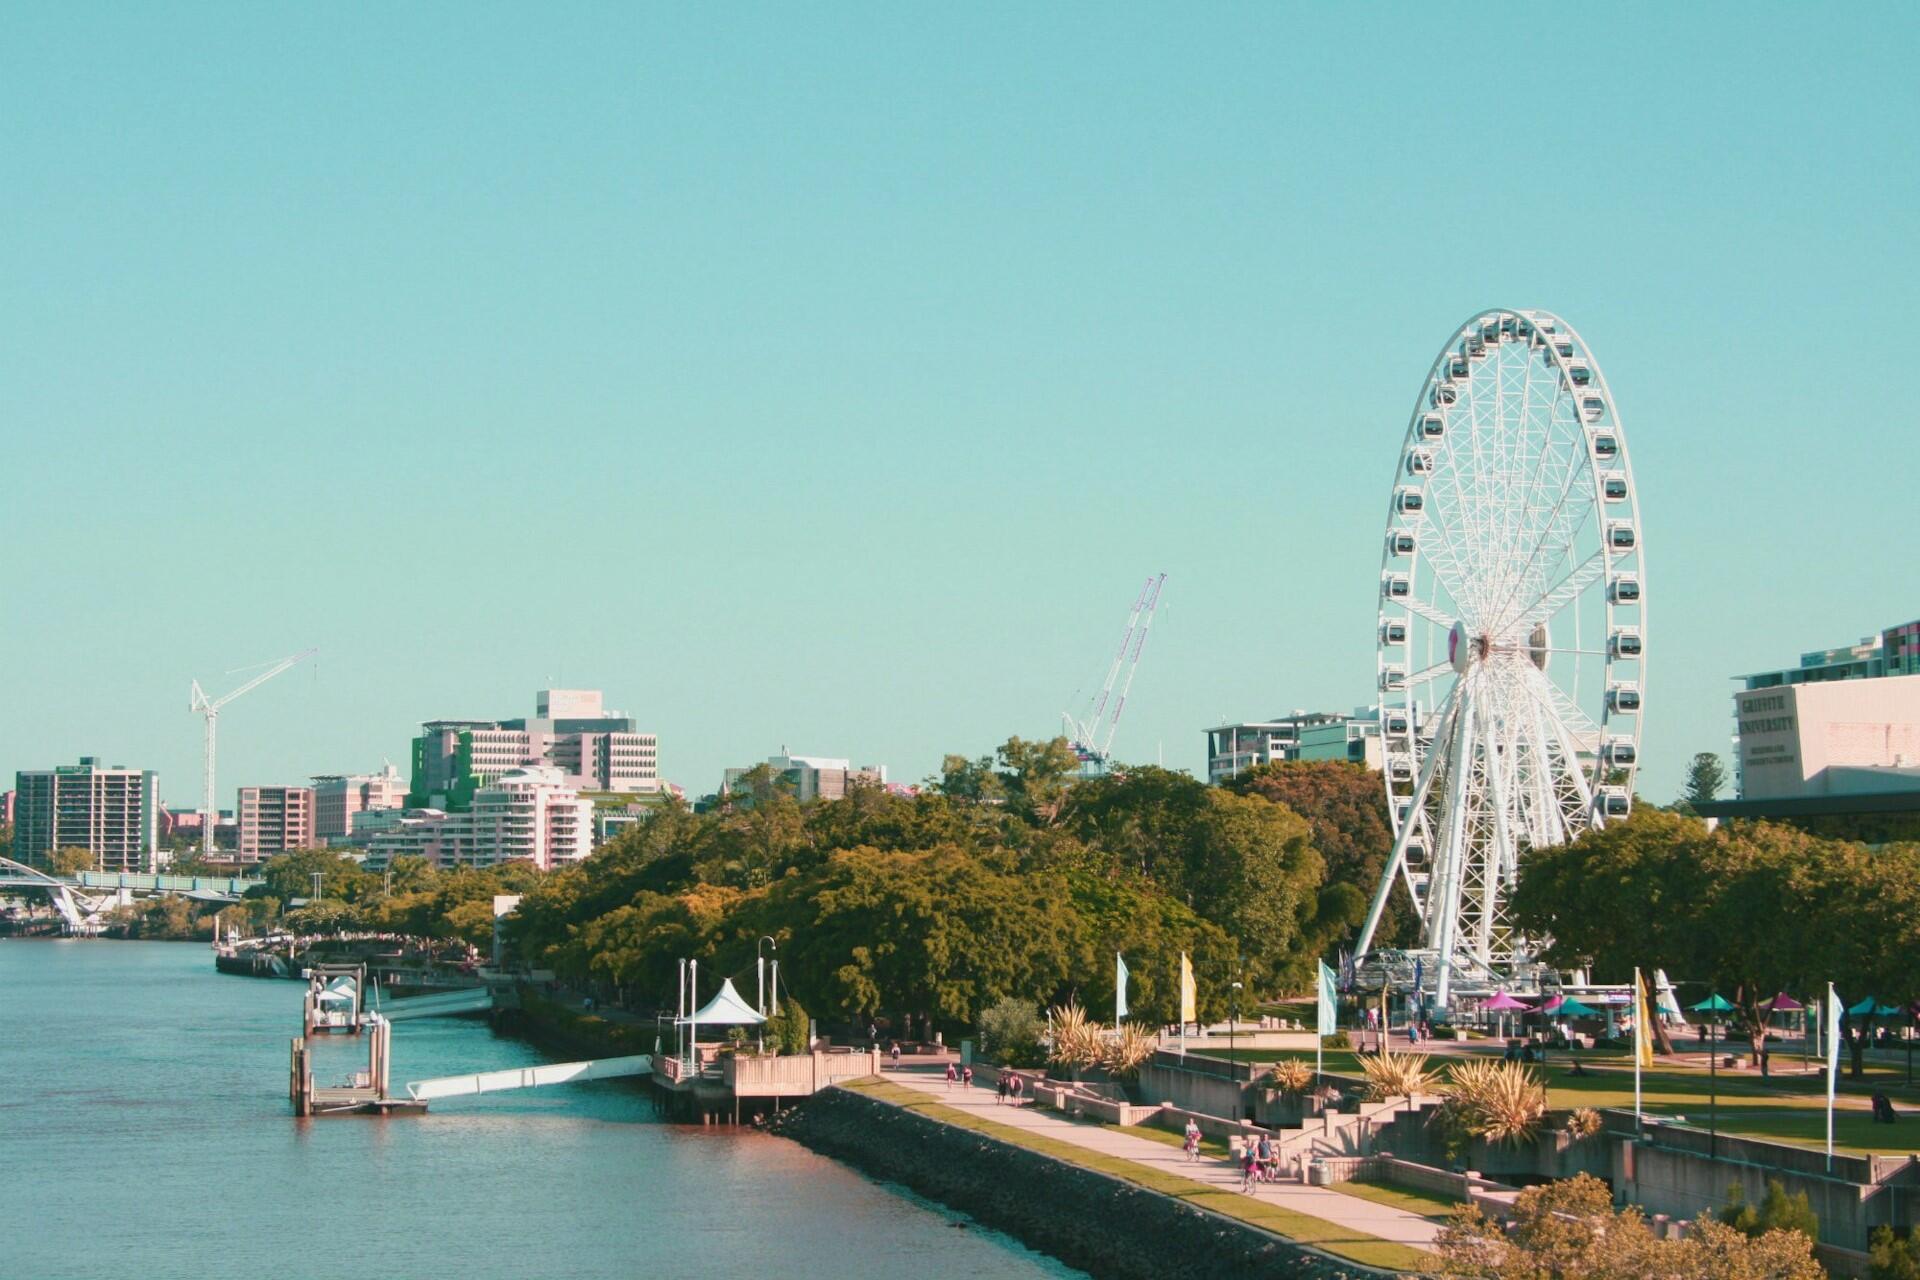
Inland Australia doesn't just have fewer residents because people had already settled on coastal areas. Even today, natural conditions and limited human development make large-scale settlement difficult. Sure, the areas have limited infrastructure since they're yet to be settled to the extent of the coastal regions, but they're also arid or semi-arid, with low rainfall and limited water sources. Australia's 10 deserts are even weaker candidates for settlement. This restricts agriculture and long-term settlement. Ultimately, the regions are less practical for large populations.⁷
Australia's interior, often referred to as the Outback, is largely arid or semi-arid. Limited rainfall, extreme temperatures, and vast distances between service areas make large-scale settlement difficult, resulting in very low population density compared to coastal regions.
Coastal Australia
- Higher population density
- Major cities and urban centres
- Greater access to water and infrastructure
- More employment opportunities
- Milder climate
Inland Australia
- Very low population density
- Few large settlements
- Limited water availability
- Fewer services and infrastructure
- More extreme climate conditions
Major Urban Centres and Their Growth
You'll find most of Australia's population in a small number of major cities and urban centres. Australia's major cities have seen steady population growth over recent years, according to national statistics and ABS data, driven by migration, economic activity, and established infrastructure. Capital cities, supported by federal government and state-level investment, continue to be the focal point of population growth in the country or continent of Australia (you can think of it as both).³
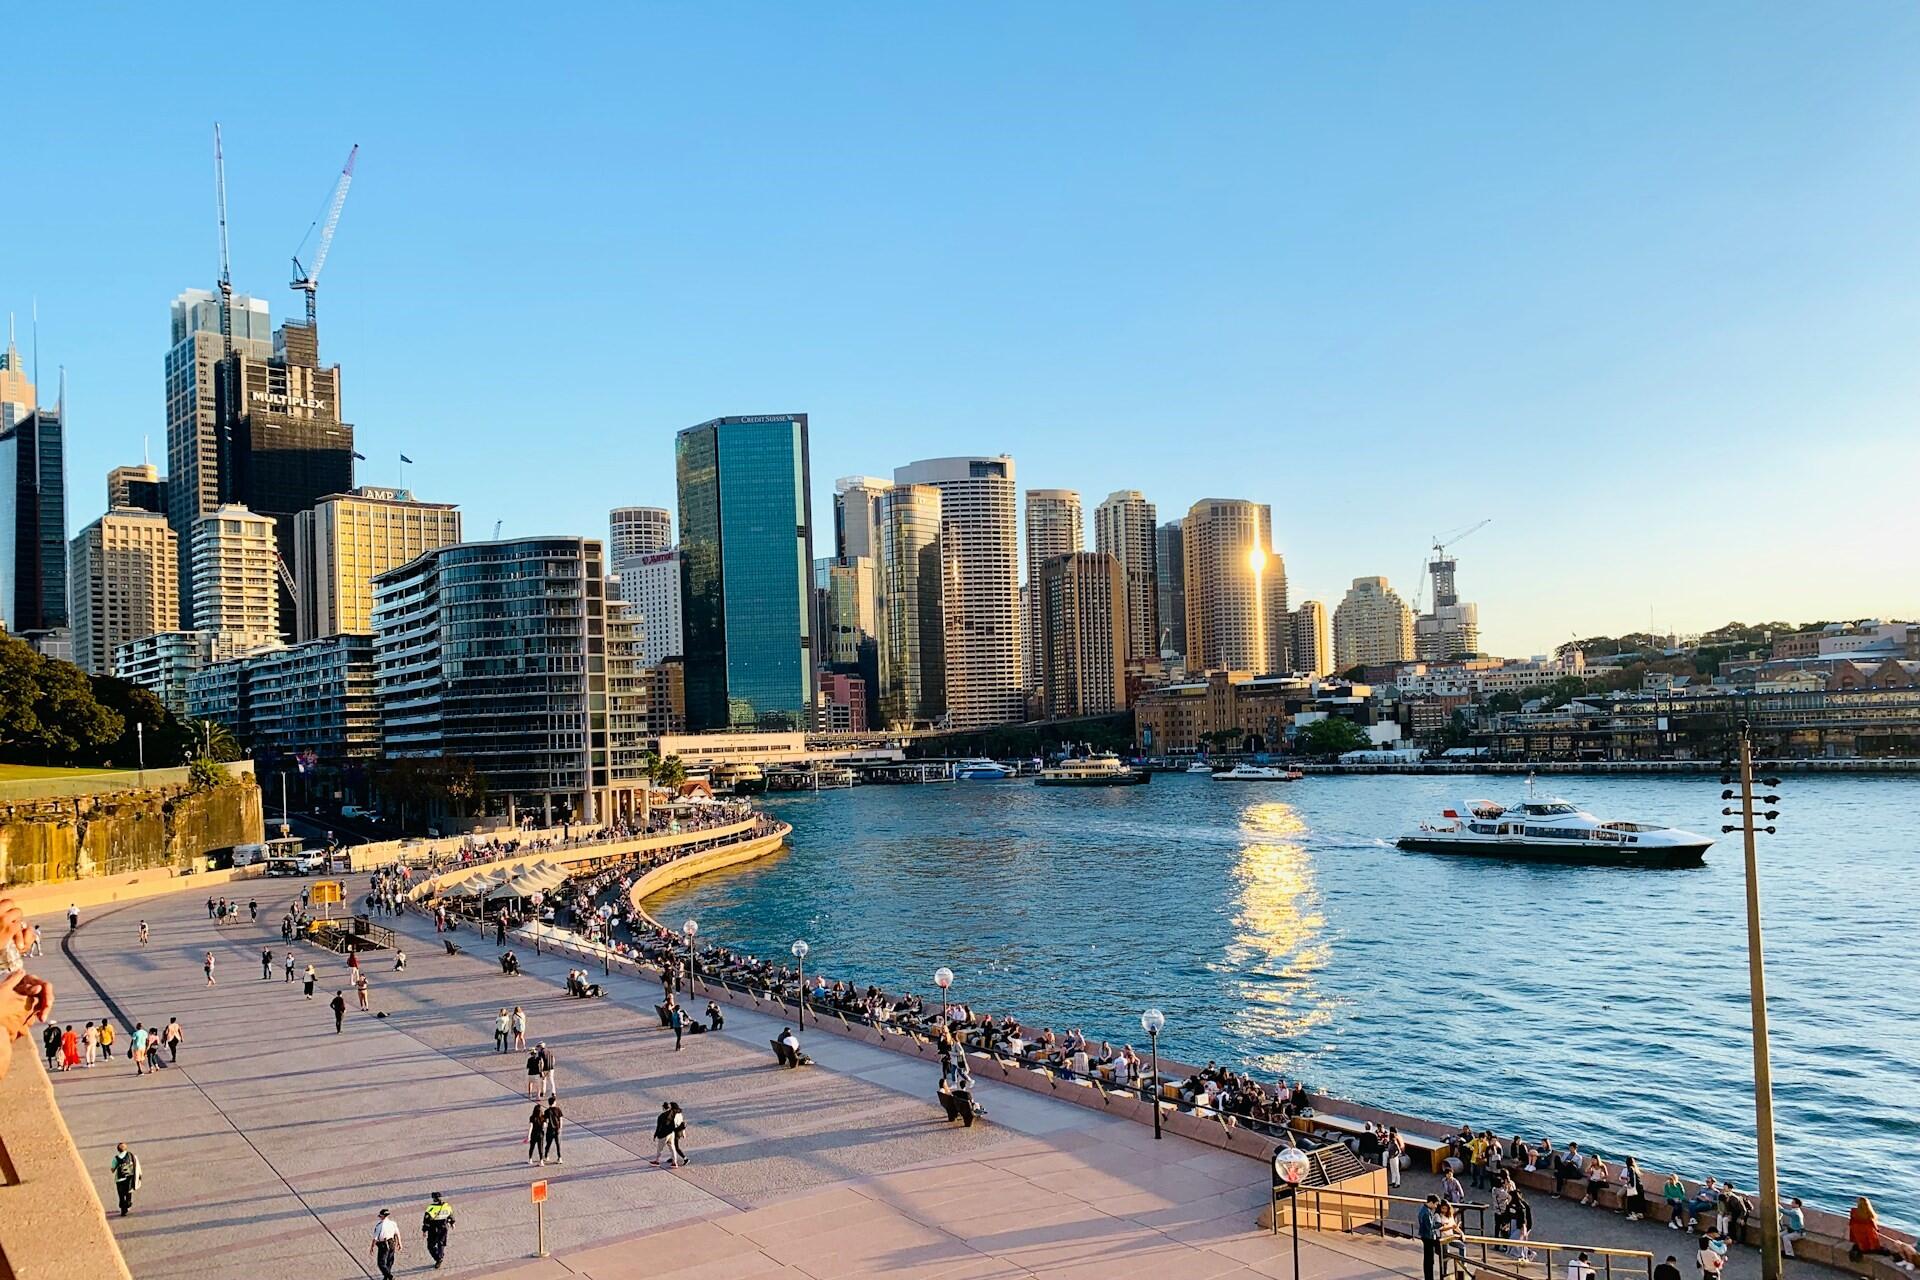
live in major cities.
Largest Cities and Their Populations
5.3 million
5.2 million
2.7 million
2.2 million
1.4 million
700,000
500,000
450,000
350,000
300,000
Factors Influencing Urban Growth
Concentration of jobs in finance, education, healthcare, and services
People born overseas settle mainly in major cities³
Movement from regional and inland areas toward urban centres
Universities and training institutions located in cities
Public transport, roads, and connectivity support larger populations⁴
Access to hospitals, specialists, and public services
Expansion of suburbs and high-density housing
Cities act as centres for business and investment⁴
Public sector employment, particularly in Canberra
Reinforces existing population patterns
Implications of Population Distribution
Australia's population distribution presents unique opportunities and challenges. Government planning uses population data and development strategies to decide how infrastructure, services, and resources are delivered. With high concentrations in coastal cities, there's pressure on housing, transport, and public services. In the low-density regions, there are different challenges, including the vast distances across the huge country. These patterns influence environmental management and long-term development decisions nationwide.⁴
Infrastructure and Resource Allocation
Investment focused on roads, rail, and public transport in major cities
Increased demand in urban areas drives expansion and higher-density development
Greater availability in cities compared to regional and remote areas
Schools and universities concentrated in urban centres
Infrastructure prioritised where population density is highest
Limited access to services in inland and remote communities
Higher expenditure required in densely populated areas
Environmental Considerations
Growth of cities leads to land use changes and habitat loss
Higher population increases demand on coastal ecosystems
Supply challenges in both growing cities and dry inland regions
Coastal populations face risks such as flooding and sea level rise
Environmental stress in arid regions limits sustainable development
Protected areas and national parks help manage environmental impact
Future Trends and Projections
The current situation in Australia isn't likely to change. According to ABS statistics and recent population data, the population is expected to grow over the coming years, with the biggest increases in major cities. Urban areas will absorb the majority of population growth each year, based on current data trends. Migration patterns, including people born overseas, and the concentration of jobs, services, and infrastructure in urban centres are expected to continue.
If you'd like to learn more about Australian geography, look for a tutor on Superprof. There are tutors across Australia and around the world (though most will likely live near the ocean). With most offering a free first session, you can even try a few before choosing the right fit for you.
References
- Australian Bureau of Statistics. National, State and Territory Population. Australian Government, https://www.abs.gov.au/statistics/people/population/national-state-and-territory-population/latest-release. Accessed 23 Apr. 2026.
- Bureau of Infrastructure, Transport and Regional Economics. An Introduction to Where Australians Live. Australian Government, https://www.bitre.gov.au/sites/default/files/An-introduction-to-where-Australians-live-BITRE-Information-Sheet-96.pdf. Accessed 23 Apr. 2026.
- Centre for Population. 2025 Population Statement. Australian Government, https://population.gov.au/publications/statements/2025-population-statement. Accessed 23 Apr. 2026.
- Infrastructure Australia. State of Australian Cities Report – Chapter 3. Australian Government, https://www.infrastructure.gov.au/sites/default/files/migrated/infrastructure/pab/soac/files/SOAC_Chapter_3.pdf. Accessed 23 Apr. 2026.
- Australian Institute of Health and Welfare. Profile of Australia’s Population. AIHW, https://www.aihw.gov.au/reports/australias-welfare/profile-of-australias-population. Accessed 23 Apr. 2026.
- Australian Housing and Urban Research Institute. Growing Australia’s Smaller Cities to Better Manage Population Growth. AHURI, https://www.ahuri.edu.au/sites/default/files/documents/2022-08/AHURI-Final-Report-386-Growing-Australias-smaller-cities-to-better-manage-population-growth.pdf. Accessed 23 Apr. 2026.
- Bureau of Infrastructure, Transport and Regional Economics. The Evolution of Australia’s Towns. Australian Government, https://www.bitre.gov.au/sites/default/files/report_136_CHAPTER_7_WEB_FA.pdf. Accessed 23 Apr. 2026.
Summarise with AI:
Did you like this article? Leave a rating!

 Loading...
